


New article
Recently updated
Overview of noise event charts

Who is this article for?
Users working with noise event charts.
Admin module access is required.
The admin module provides several chart types to help you analyse noise events from aircraft and other sources over selected time periods.
Accumulated noise events by dB(A) chart
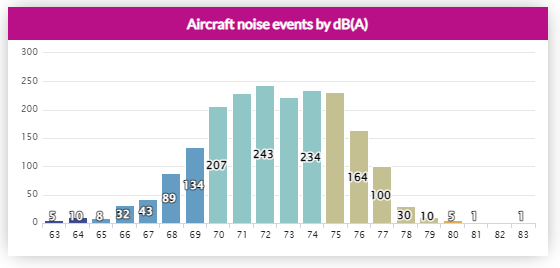
This chart displays the number of noise events produced by aircraft and any other source for a selected period. The columns represent groups of noise events, and a single noise event can be counted into multiple groups.
By default, this chart shows three groups:
- NA60 - The number of noise events that have a maximum dB(A) value of 60 or higher
- NA70 - The number of noise events that have a maximum dB(A) value of 70 or higher
- NA80 - The number of noise events that have a maximum dB(A) value of 80 or higher
For example, a noise event peaking at 90 dB(A) counts in all three groups, as it meets each group's criteria. A noise event peaking at 64 dB(A) counts only in the first group (NA60), as it doesn't meet the others' conditions.
Accumulated noise events by altitude chart
This chart displays the number of noise events produced by aircraft and any other source for the selected period. The bars represent groups of noise events, and a single noise event can be counted into multiple groups.
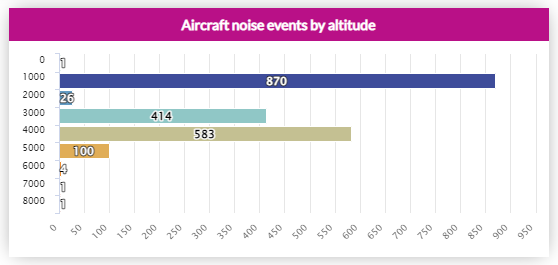
By default, this chart shows 10 groups representing the number of noise events produced at different altitudes:
- < 1000 - Below 1000 feet
- 1000 - 1000 feet or higher
- 2000 - 2000 feet or higher
- 3000 - 3000 feet or higher
- 4000 - 4000 feet or higher
- 5000 - 5000 feet or higher
- 6000 - 6000 feet or higher
- 7000 - 7000 feet or higher
- 8000 - 8000 feet or higher
- 9000 - 9000 feet or higher
For example, a noise event at 11,000 feet counts in all groups meeting the conditions. An event at 4,928 feet counts only in the '< 1000', '1000', '2000', '3000', and '4000' groups, as other conditions are not met.
Average aircraft noise events per hour chart
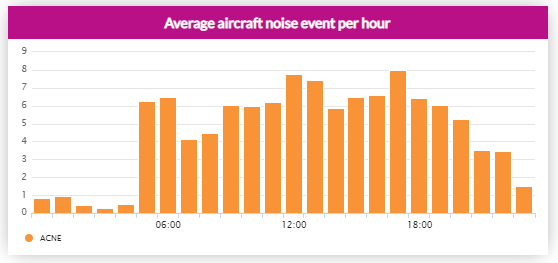
This chart displays the average number of aircraft noise events per hour of the day for the selected period. Aircraft noise events are noise events that have been confirmed to have been caused by an aircraft.
The chart functions similarly to the 'Noise events per hour' chart but instead of adding all the values of the hour ranges of the days in the selected period together, an average is calculated based on the number of days in the selected period.
For example, if a period is selected from 1 December 2019 to 5 December 2019 with the following values for the 00:00–01:00 hour range:
- 1 December 2019, 00:00–01:00: 4 aircraft noise events
- 2 December 2019, 00:00–01:00: 13 aircraft noise events
- 3 December 2019, 00:00–01:00: 7 aircraft noise events
- 4 December 2019, 00:00–01:00: 10 aircraft noise events
That would make for a total of 32 (4 + 13 + 7 + 10) aircraft noise events over a four-day period, which gives an average of 8 (32 / 4) aircraft noise events. That value would be displayed in the chart's column representing the 00:00–01:00 hour range.
Noise climates chart
A noise climate represents the average noise over a period, where multiplying this by the period's seconds gives the noise energy. dB values are converted to noise energy for accurate summation.
The monthly noise climate shows average noise for day, evening, and night. Before month-end, it uses completed days to calculate a running average. After month-end, the 90th percentile is calculated, meaning 90% of noise levels exceed this value.